Technical analysis is a powerful method used in trading. Whether you trade crypto, forex, or stocks, technical analysis helps you understand market behavior by studying price charts and patterns. Instead of guessing where the market might go, you make decisions based on data, logic, and probability.
What Is Technical Analysis?
Technical analysis is the study of price movement, volume, and market structure using charts. The main idea is simple:
?Price reflects everything – news, emotions, fear, greed, and expectations.
Analyzing historical price data, traders try to predict future price movements. Technical analysis does not focus on company news or fundamentals; it focuses only on what price is doing on the chart.
Traders Use Technical Analysis For Price Movement
Technical analysis is popular because it works in all markets and timeframes.
Key benefits of Technical Analysis :
- Helps identify clear entry and exit points
- Works for short-term and long-term trading
- Improves risk management
- Reduces emotional trading
- Perfect for volatile markets like crypto
This is why professional traders rely heavily on charts rather than opinions.
Core Elements of Technical Analysis
1. Price Charts
The most common chart types are:
- Line charts
- Bar charts
- Candlestick charts most popular
Candlesticks clearly show buying and selling pressure, making them ideal for technical analysis.
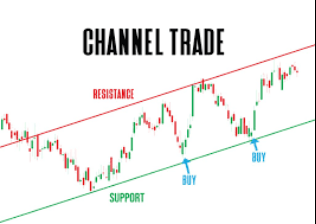
2. Support and Resistance
Support is a price level where buyers usually enter the market.
Resistance is where sellers become active.
Most strong trading opportunities appear near the zones. Learning to draw support and resistance correctly is one of the most valuable skills in trading.
3. Trends and Market Structure
Markets move in trends:
- Uptrend: higher highs, higher lows
- Downtrend: lower highs, lower lows
- Sideways: range-bound movement
Trading in the direction of the trend increases your probability of success.
4. Indicators
Indicators help confirm price action. Popular ones include:
- Moving Averages
- RSI (Relative Strength Index)
- MACD
- Volume indicators
Indicators should support your analysis, not replace price reading.
Tools and Platforms for Technical Analysis?
Apply technical analysis effectively, you need reliable platforms with clean charts and fast execution.
Recommended Trading Platforms:
These platforms provide:
- Advanced charting tools
- Real-time market data
- Multiple indicators
- Mobile and desktop access
Risk Management: Crypto Trading
Technical analysis? is not without risk management. Even the best setups can fail.
Always remember:
- Risk only 1?2% of your account per trade
- Use stop-loss orders
- Avoid overtrading
- Focus on consistency, not quick profits
Successful traders protect their capital first.
Common Mistakes Beginners Make
- Using too many indicators
- Ignoring higher timeframes
- Trading without a plan
- Chasing trades emotionally
- Not respecting stop-loss levels
Keeping your analysis simple often leads to better results.
Final Tips For Technical Analysis Traders
Technical analysis is not about predicting the market perfectly. It is about managing probability, risk, and discipline. When used correctly, it gives you structure, confidence, and control over your trading decisions.
If you want to grow as a trader, mastering technical analysis is a must. Start slow, practice regularly, and focus on understanding price behavior rather than chasing signals.
Disclaimer: This content is for educational purposes only and does not constitute financial advice.

Leave a comment